
Boulama
Real-Time Stock Price Chart with SocketBee, Python, and Vue.js
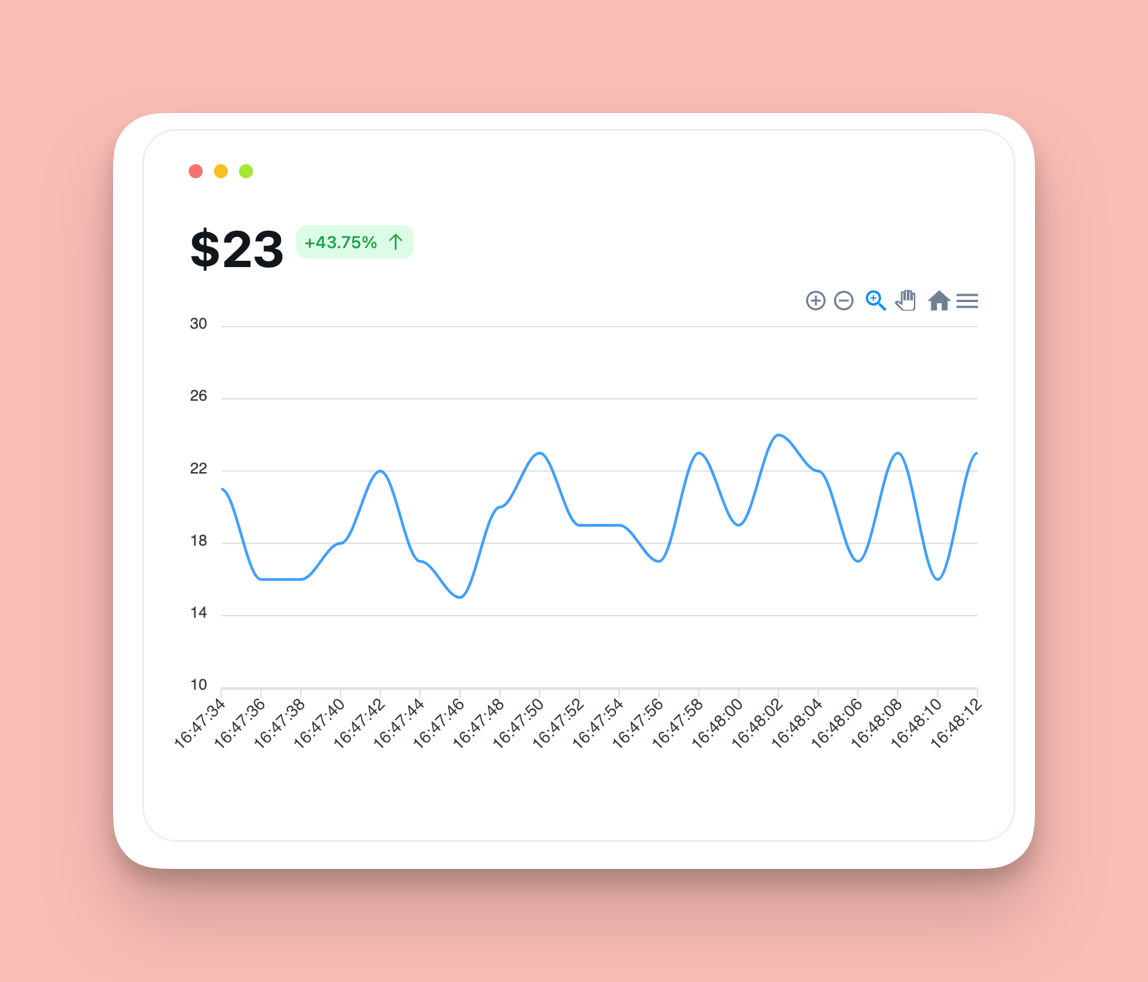
In this demo showcasing the capabilities of SocketBee, we have created a graph representing a company's stock price in real time.
 In this tutorial, we will go over how to recreate it using SocketBee's official clients for JavaScript and Python.
Prerequisites
In this tutorial, we will go over how to recreate it using SocketBee's official clients for JavaScript and Python.
Prerequisites
Before we start, make sure you have the following installed on your system:
- Python 3.x
- Node.js (v12 or later)
- npm (comes bundled with Node.js)
Step 1: Set up the Python Environment
- Create a new directory for your project and navigate to it in your terminal.
mkdir stock-price-chart
cd stock-price-chart
- Create a new virtual environment for your Python project.
python3 -m venv env
- Activate the virtual environment.
source env/bin/activate # On Windows, use `env\Scripts\activate`
- Install the required Python libraries.
pip install numpy socketbee
- Create a new file called
server.pyand open it in your preferred code editor.
Step 2: Write the Python Server Code
Paste the following code into server.py:
import time
import numpy as np
from socketbee.client import SocketBee

# Connect to SocketBee
opts = {
    'secret': 'your_secret_key',
    'client_events': 'true'
}
s = SocketBee('your_public_key', 'your_client_id', opts).connect()

while True:
    # Generate random stock price data
    stock_price = np.random.randint(15, 25)

    # Create the event data
    event_data = {
        'stock_price': stock_price
    }

    # Broadcast the event data to SocketBee
    s.broadcast('stock_price_update', event_data, 'stock_channel')

    # Wait for 1 second before sending the next update
    time.sleep(1)
Replace 'your_secret_key', 'your_public_key', and 'your_client_id' with your actual SocketBee credentials.
Here is how the code above works, and what it does:
- We import the necessary libraries:
timefor adding delays,numpyfor generating random numbers, andsocketbee.clientfor interacting with SocketBee. - We connect to SocketBee by providing our credentials and creating a SocketBee instance.
- Inside the
whileloop, we generate a random stock price between 15 and 25 usingnp.random.randint. - We create an event data dictionary with the stock price.
- We broadcast the event data to SocketBee using the
broadcastmethod, specifying the event name'stock_price_update'and the channel name'stock_channel'. - We add a delay of 1 second using
time.sleep(1)before sending the next update.
Step 3: Set up the Vue.js Application
- Open a new terminal window and navigate to your project directory.
cd stock-price-chart
- Create a new Vue.js project using the Vue CLI.
npm install -g @vue/cli
vue create frontend
Follow the prompts to configure your Vue.js project.
- Once the project is set up, navigate to the
frontenddirectory.
cd frontend
- Install the required dependencies.
npm install @socketbee/client apexcharts vue-apexcharts
- Open the
frontenddirectory in your code editor.
Step 4: Write the Vue.js Code
Here is an overview of what we will do:
- We import the necessary libraries:
SocketBeeClientfor interacting with SocketBee, andrefandonMountedfrom Vue for reactivity and lifecycle hooks. - We initialize the
seriesandchartOptionsdata for ApexCharts. - We create a new SocketBeeClient instance and connect to SocketBee using our credentials.
- Inside the
onMountedhook, we subscribe to the'stock_channel'and listen for the'stock_price_update'event. - When a stock price update is received, we update the chart data by pushing the new stock price to the
seriesdata and adding a new category (timestamp) to thechartOptions.
Let's go step by step.
- Create a new component called
StockChart.vuein thesrc/componentsdirectory. - Paste the following code into
StockChart.vue:
<template>
  <div>
    <apexchart
      type="line"
      :options="chartOptions"
      :series="series"
    ></apexchart>
  </div>
</template>

<script>
import SocketBeeClient from "@socketbee/client";
import { ref, onMounted } from "vue";

export default {
  setup() {
    const series = ref([
      {
        name: "Stock Price",
        data: [],
      },
    ]);

    const chartOptions = ref({
      chart: {
        id: "stock-price-chart",
      },
      xaxis: {
        categories: [],
      },
    });

    // Connect to SocketBee
    const s = new SocketBeeClient(
      "your_public_key",
      "your_client_id",
      {
        client_events: false,
        port: 443,
        server: "east-1.socket.socketbee.com",
      }
    );

    onMounted(() => {
      // Subscribe to the stock channel
      const channel = s.subscribe("stock_channel", (...args) => {});

      // Listen for stock price updates
      channel.listen("stock_price_update", (...args) => {
        const stockPrice = args[0].stock_price;

        // Update the chart data
        series.value[0].data.push(stockPrice);
        chartOptions.value.xaxis.categories.push(new Date().toLocaleTimeString());
      });
    });

    return {
      series,
      chartOptions,
    };
  },
};
</script>
Replace 'your_public_key' and 'your_client_id' with your actual SocketBee credentials.
- Open
src/App.vueand replace the content with the following:
<template>
  <div id="app">
    <StockChart />
  </div>
</template>

<script>
import StockChart from "./components/StockChart.vue";

export default {
  name: "App",
  components: {
    StockChart,
  },
};
</script>
Step 5: Run the Applications
- In the terminal window where you activated the Python virtual environment, run the Python server:
python server.py
- In the other terminal window, start the Vue.js development server:
npm run serve
- Open your web browser and navigate to
http://localhost:8080. You should see a real-time stock price chart updating every second.
Congratulations! You have successfully built a real-time stock price chart application using SocketBee for bi-directional communication between the Python server and Vue.js frontend. This tutorial covered the following key concepts:
- Setting up a Python environment and installing required libraries
- Writing a Python script to simulate stock price data and broadcast it to SocketBee
- Creating a Vue.js application and integrating it with SocketBee
- Rendering real-time stock price data using ApexCharts
This little app demonstrates the power of SocketBee in facilitating real-time communication between servers and clients. By leveraging WebSockets, you can build highly responsive and interactive applications that update seamlessly as new data becomes available.
While this tutorial focused on a stock price chart, the concepts you learned can be applied to various other scenarios that require real-time data updates, such as live dashboards, chat applications, multiplayer games, and more. SocketBee has many more applications and use cases to explore.
Feel free to explore the SocketBee documentation (coming soon) and examples to learn more about what you can build with SocketBee. Additionally, you can integrate other libraries and frameworks with SocketBee to build more complex and feature-rich applications.
If you haven't already, request an invite for a free SocketBee account and start building your own real-time applications today!